(c) Profile Systems Design Group, Inc. 2026 Build: 4.008.811 Help ID: 1770
If you do not see the expected content,press CTRL + F5 to clear your Browser's cache.
Data View
Data View allows you to select which report fields to display and presents the report in a table format, which can then be sorted, filtered, and exported.
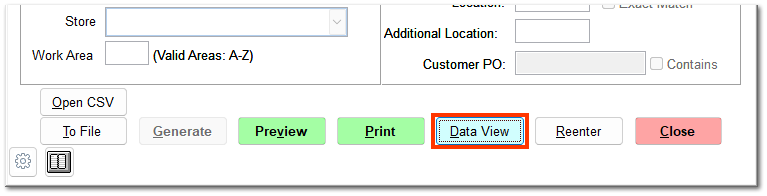
After generating a report, click Data View on the report form.
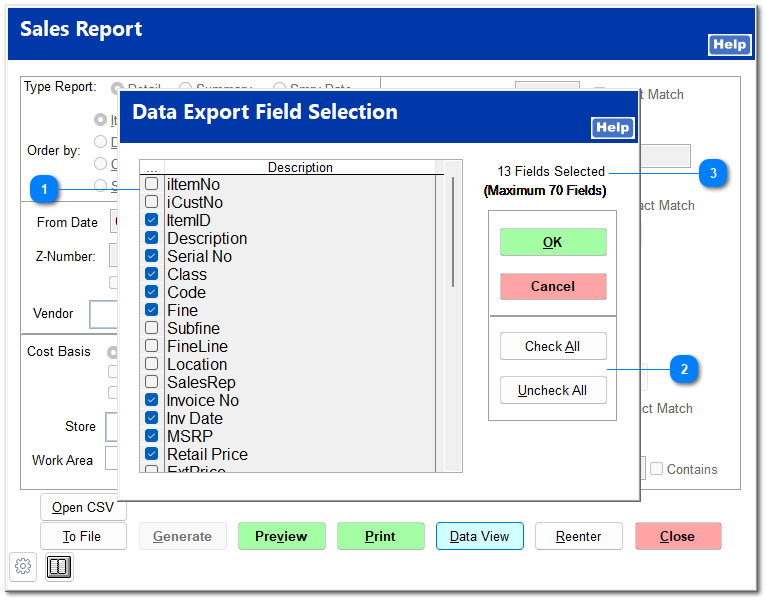
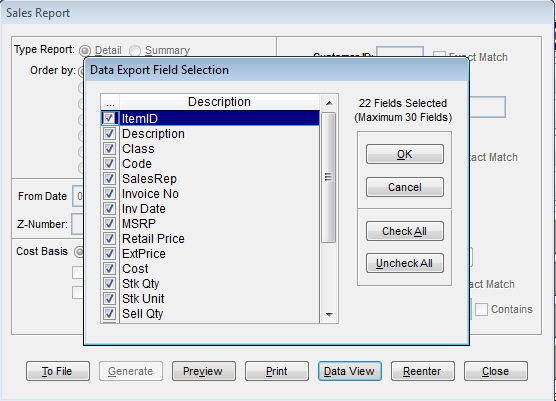
The Data Export Field Selection screen opens for you to choose the fields to include in the view.
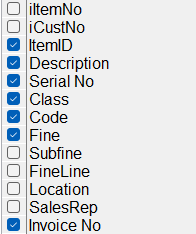
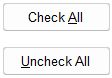
By default, all fields are selected to be included in the view. Uncheck the fields you do not wish to include. Alternatively, you can click Uncheck All and then check only the fields to include.
Once you have selected your desired fields, click OK.
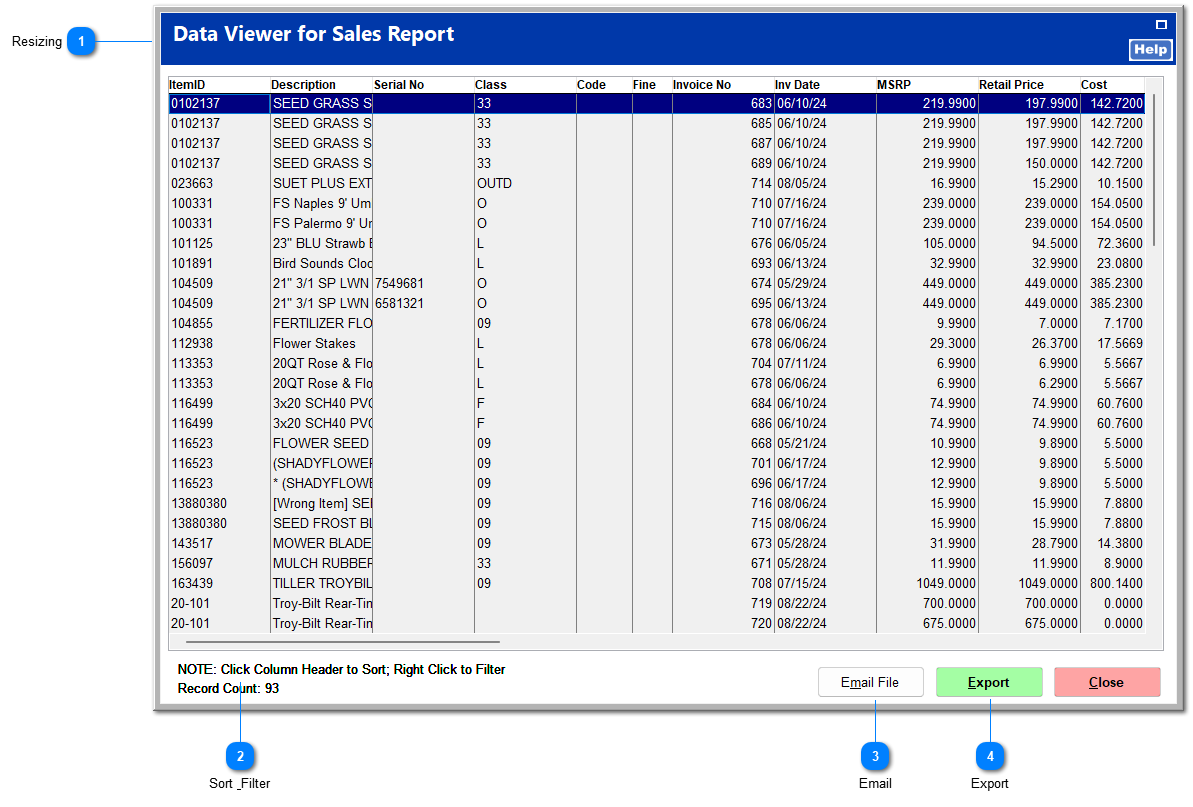
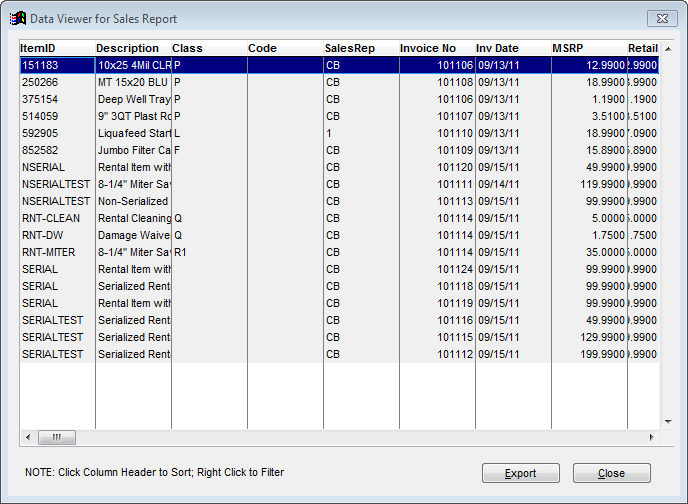
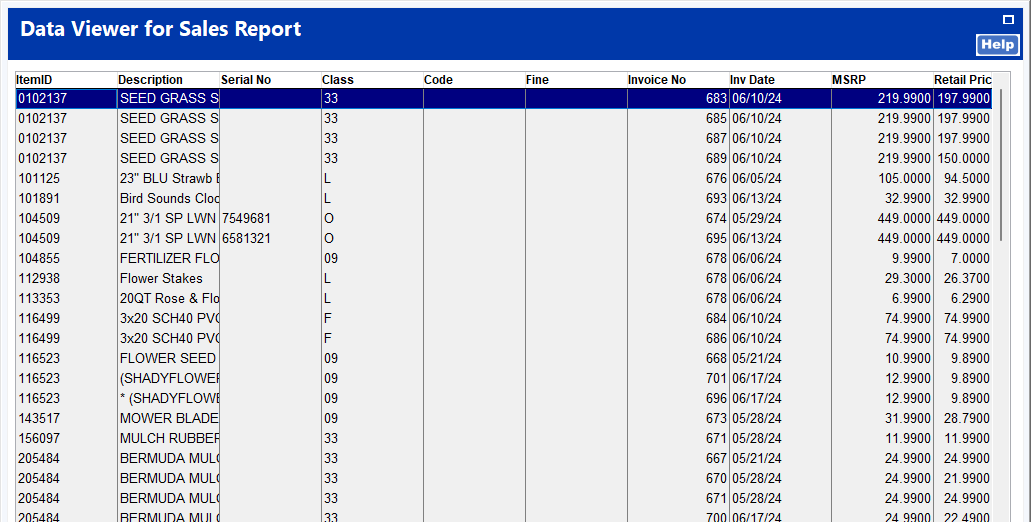
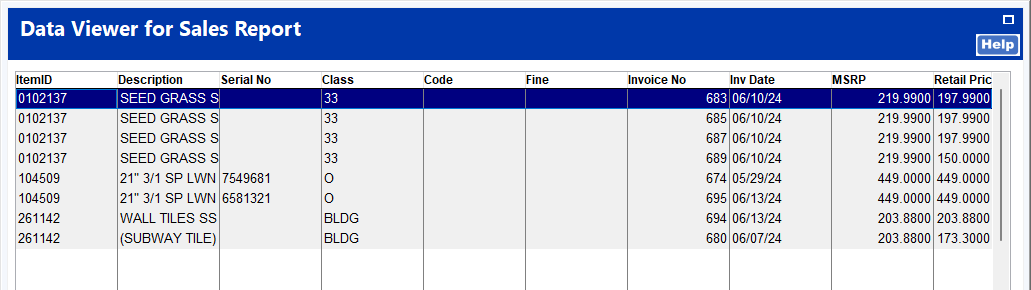
The Data Viewer opens, displaying all the data in the fields selected.
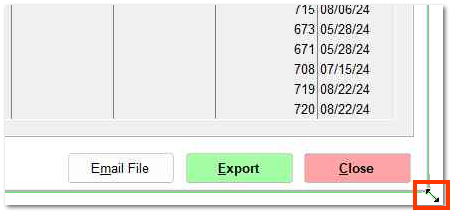
Resizing
You can resize the Data Viewer similarly to windows in other programs. Hover over the bottom right corner of the window until the cursor turns into a double arrow, and then click and drag to the desired size.
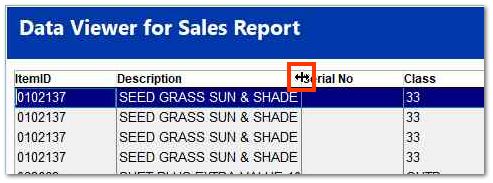
You can resize any column within the Data Viewer to better fit the data. Hover over the divider between columns until the cursor turns into a double arrow, and then click and drag to the desired size.
You can sort data by any column by left-clicking on the column header you wish to sort by.
This is the result of sorting the example view by Class.
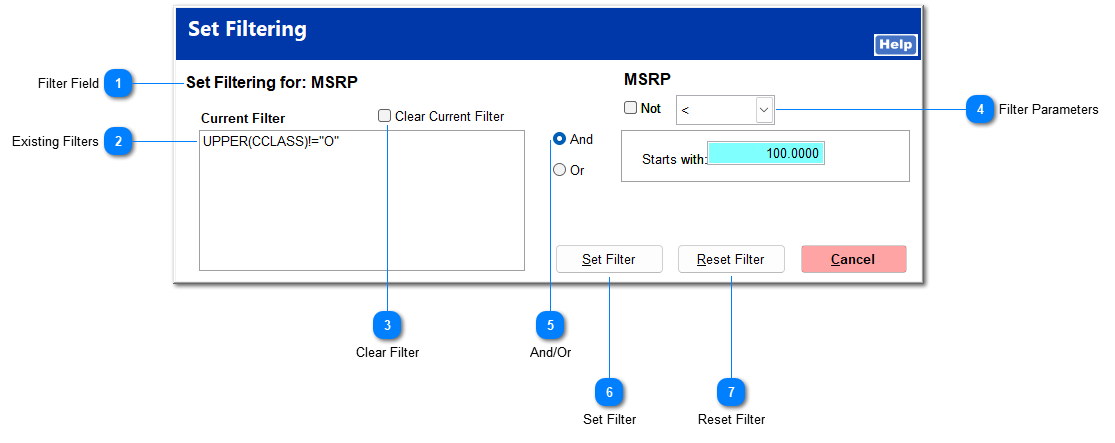
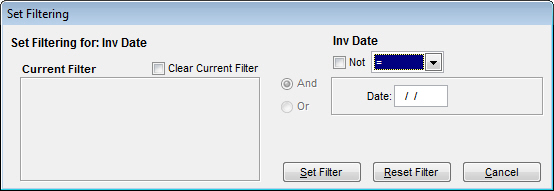
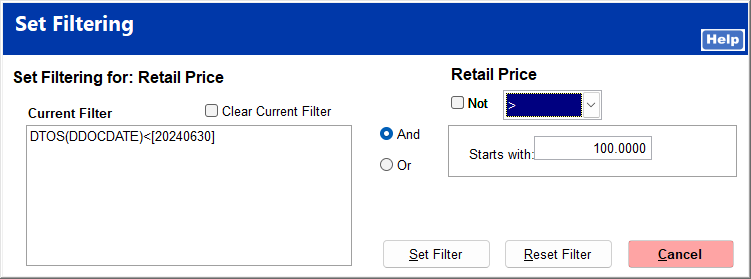
You can also filter the data to find only entries with a particular value or word. To filter, right-click on the header of the column containing the information you wish to filter for. The Set Filtering Screen opens for you to enter filter parameters.
Filter Field
This displays the field you are creating a filter for.
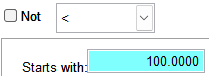
Use the logic symbols in this dropdown menu along with a number in the Starts with field to build a filter statement. The format of the Starts with field may change depending on the column selected.
Dates must be entered by typing rather than using the Date Picker for the date filter to run correctly.
Checking Not displays all data except entries that fall within the filter parameter.
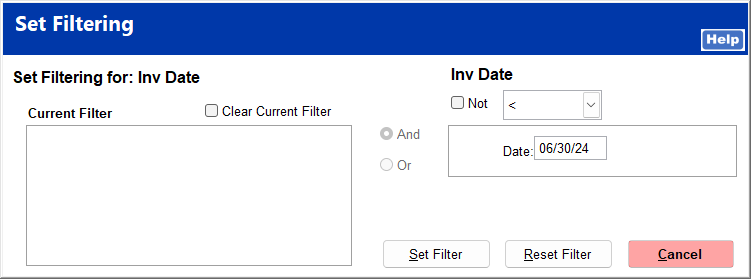
Here are a few examples using the Sales Report Data Viewer shown.
To filter for invoice dates prior to a particular date, right-click the Inv Date column header. In the filter parameters, select the less than symbol <, and enter the date.
Click Set Filter to view the results.
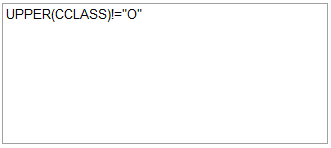
To also filter for only items with retail price over $100, right-click the Retail Price column header. The invoice date filter previously applied is shown in the Current Filter field. Leave the And button selected so that both filters are applied. In the filter parameters, select the greater than symbol >, and enter 100.00 in the Starts with field.
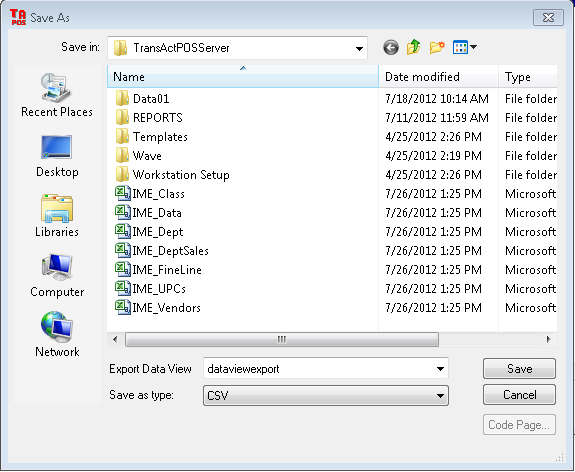
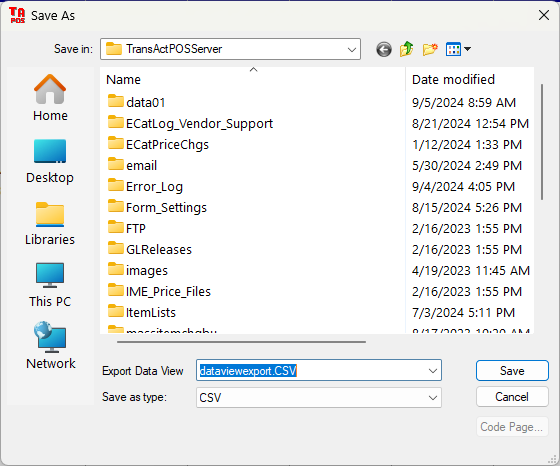
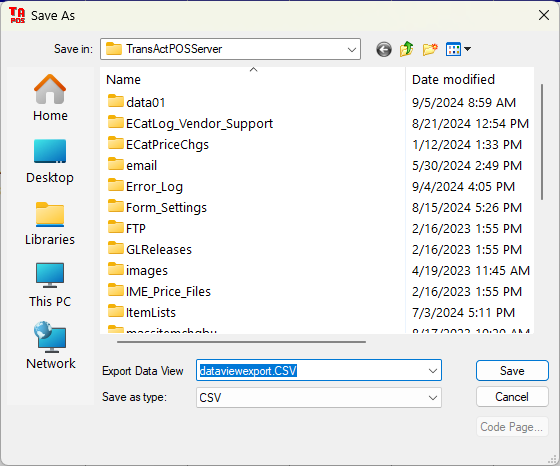
This allows you to email a copy of the Data View directly. Upon clicking Email File, you are prompted to save the file. Enter a file name, select a location, and click Save.
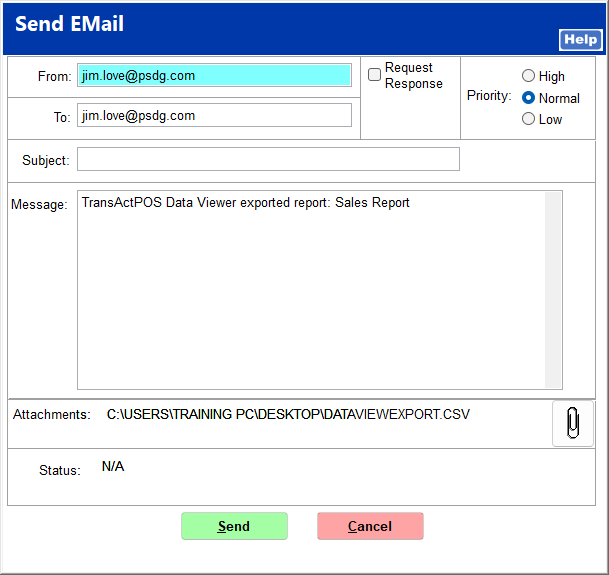
The Send Email screen opens with the file attached. Enter the From and To email addresses, enter a subject if desired, and click Send.