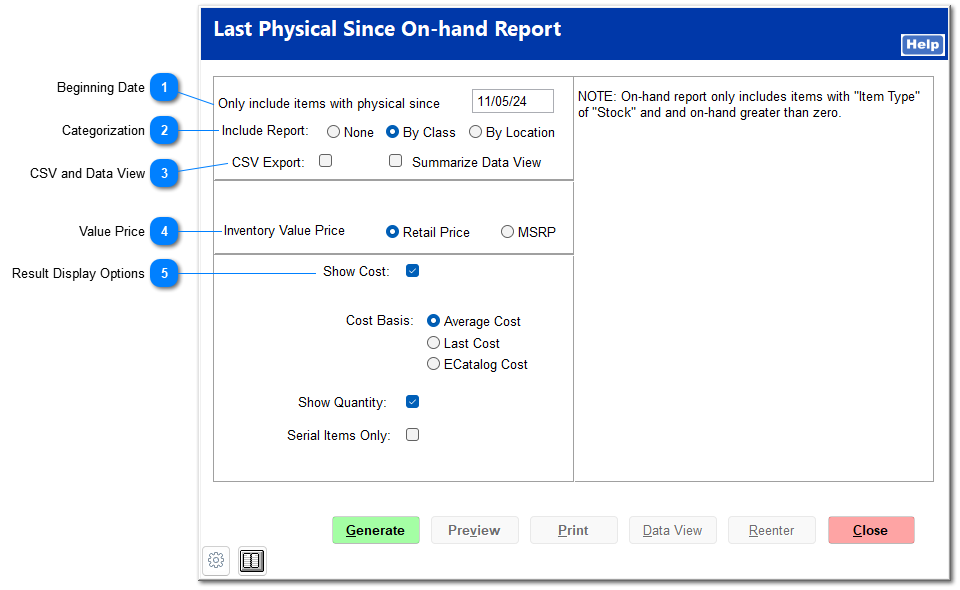
The Last Physical Since On-Hand report shows the value of items that have been physically adjusted since the last on-hand report was run.
 Beginning DateEnter the date of the last on-hand report (the date from which to start the report).
|
|
 CategorizationYou can categorize report results by class, location, or nothing.
|
|
 CSV and Data View| | CSV Export is only available for a By Class or By Location report. Summarize Data View is only available for a By Class report.
|
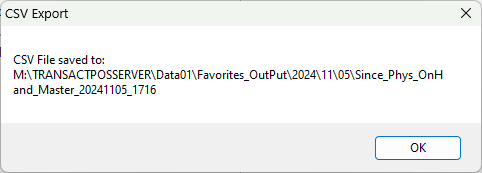
Check CSV Export to export the item information to a CSV file. The file path is shown upon clicking Generate.
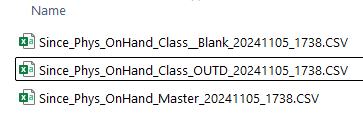
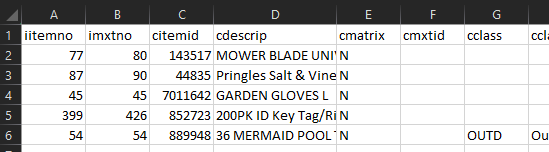
A master file is created showing all items, as well as a file for each class.
Here is an example of the master CSV file:
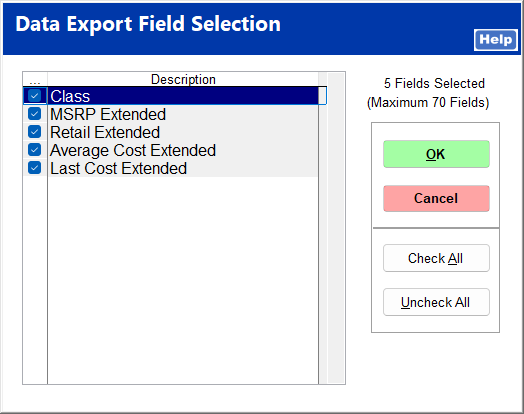
Checking Summarize Data View minimizes the fields available to select for Data View to those shown.
|
|
 Value PriceYou can display value based on your store retail price or MSRP.
|
|
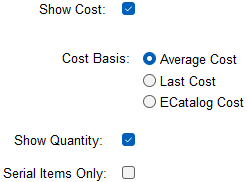
 Result Display OptionsSelect the data to display with the report results.
|
|
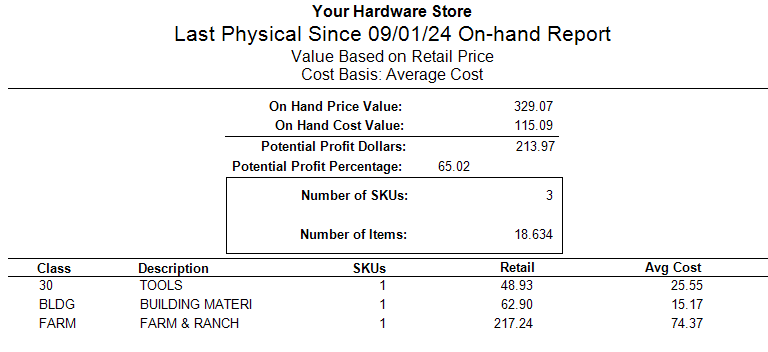
Here is an example of a default Since Physical report:
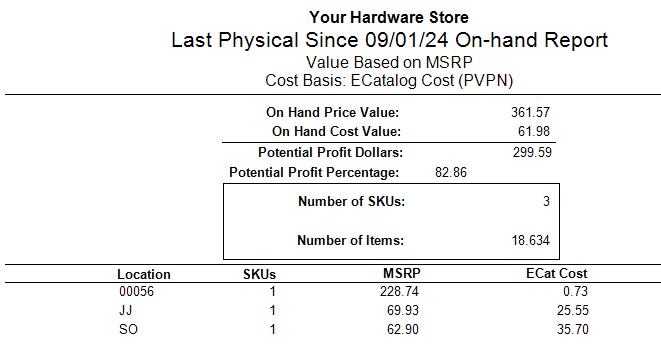
Here is an example of a report organized by location displaying MSRP and ECatalog cost: