Theory Behind Forecasting Reorder Quantities in TransActPOS
Having adequate quantities on hand is a critical factor for achieving profitable store operations. If you do not have good forecasts of customer demand, you are forced to overstock in order to maintain a high level of customer service. This equates to adding excessive weight to inventory, and ties up cash that could be used for other resources. In today's competitive environment, you must use your resources effectively, to prosper and maximize your store's profitability. You must have an accurate forecast of future product demand to enable setting a realistic minimum reorder point.
Improving the Accuracy of your Forecasts
Many stores are using the TLAR method ("That looks about right") of inventory reorder points or use default
planogram SKU suggested minimums. These methods have served retailers well for many years. As competition continues to increase, because new product channels are evolving and existing channels are expanding, independent retailers must adapt new methods of conducting business to stay competitive.
A number of business developments, including the internet and fast and reliable transportation, have drastically changed the retail environment. Customers have more options than ever to choose from when making their purchasing decision.
This "buyers market" has forced many retailers to lower profit margins in order to remain competitive. Lower margins are not the only result of this increased competition. Customers are in a position to demand more value, added services, and greater product availability.
The end result is that retailers must provide better product availability and more services with fewer profit dollars. In order to do more with less, estimates of future demand must be as accurate as possible.
Traditional Forecasting Method
#1 - Average (Past 6 Months)
One of the most widely used methods of forecasting future product demand is to average the monthly units sold from several previous periods.
|
|
January
|
February
|
March
|
April
|
May
|
June
|
July
|
|
Units Sold
|
100
|
133
|
145
|
90
|
154
|
80
|
?
|
To forecast demand for July, you can average the usage recorded over the previous six months:
(100 + 133 + 145 + 90 + 154 + 80) / 6 = 117
A forecast of 117 pieces would seem to be a realistic estimate for July.
#2 - Wt Avg (3.0 / 2.5 / 2.0 / 1.5 / 1.0 / .5)
Look at this products sales history:
|
|
January
|
February
|
March
|
April
|
May
|
June
|
July
|
|
Units Sold
|
80
|
90
|
100
|
133
|
145
|
156
|
?
|
A forecast for July calculated by averaging the previous six months sales is again 117 units.
(80 + 90 + 100 + 133 + 145 + 156) / 6 =117. But notice how usage has increased over the past several months.
It would be logical for June's sales of 156 units to have more emphasis on July's projected demand rather than January's sales of 80 units. We need the ability to weight the sales history of certain months. To accomplish this we will apply a set of weights with the average usage calculation. For this forecast, the greatest weight will be placed on the most current month and gradually decrease the weight over the previous remaining months.
|
Month
|
Units Sold
|
Weight
|
Extension
|
|
June
|
156
|
3.0
|
468.0
|
|
May
|
145
|
2.5
|
362.5
|
|
April
|
133
|
2.0
|
266.0
|
|
March
|
100
|
1.5
|
150.0
|
|
February
|
90
|
1.0
|
90.0
|
|
January
|
80
|
.5
|
40.0
|
|
Total
|
|
10.5
|
1376.5
|
The total extension of 1376.5 is divided by the total weight of 10.5 to equal a weighted average of about 131 units. A forecast of 131 appears to be better than the average usage forecast of 117 units, but it will probably still fall short of July's actual usage. Remember that past usage is just one element of a comprehensive forecast
#3 - Average (Past 3 Months)
Some items need a shorter time horizon, seasonal goods are an example of this type of merchandise.
|
|
April
|
May
|
June
|
July
|
|
Units Sold
|
90
|
154
|
80
|
?
|
This forecast for July is based on the average units sold from the previous three months.
(90 + 154 + 80) / 3 = 108
A forecast of 108 would be a reasonable forecast for July.
#5 - Average Past 3 Odd Months
Forecasting July demand with zero weight placed on July.
|
|
January
|
February
|
March
|
April
|
May
|
June
|
July
|
|
Units Sold
|
100
|
133
|
145
|
90
|
154
|
80
|
?
|
(133 + 90 + 80) / 3 = 101
This calculation will result in a forecast of 101 units for July.
Forecasting July demand with weight 2 placed on July. In this example we will use July 15th as the date of forecasting run and 75 units sold for the month of July so far.
|
|
January
|
February
|
March
|
April
|
May
|
June
|
July
|
|
Units Sold
|
100
|
133
|
145
|
90
|
154
|
80
|
75
|
(145 + 154 + 2(75)) / 3 =
(145 + 154 + 150) / 3 = 150
This calculation will result in a forecast of 150 units for July.
Last Year Average 3 Months
Option #6 in TransActPOS Forecasting
This forecasting method is very useful for seasonal items.
|
|
January
|
February
|
March
|
April
|
May
|
June
|
July
|
|
Units Sold
|
100
|
133
|
145
|
90
|
154
|
80
|
?
|
This years sales history
|
|
June
|
July
|
August
|
September
|
October
|
November
|
December
|
|
Units Sold
|
120
|
140
|
145
|
130
|
125
|
90
|
95
|
Previous years sales history
(140 + 145 + 130) / 3 = 138
This calculation will result in a forecast of 138 units for July.
The Effect of Unusual Usage
Averaging past usage does not always result in an accurate forecast of future demand. If your store experiences an unusually large sale of a product, averaging the usage in the past six months would result in an inaccurate forecast. For example, suppose your store experienced an unusually large sale of 1,000 units of the product we examined above.
|
|
January
|
February
|
March
|
April
|
May
|
June
|
July
|
|
Units Sold
|
100
|
133
|
145
|
90
|
154
|
1080
|
?
|
Averaging the previous six months results in a forecast of 284 pieces:
(100 + 133 + 145 + 90 + 154 + 1080) / 6 = 284
But is 284 pieces a good estimate of July's demand? Probably not. To help ensure forecast accuracy, we must adjust usage history for any unusual activity that will probably not reoccur. It is a good idea to examine all instances where the demand forecast differs significantly from historical usage. Abnormally large sales are just one type of unusual activity. Consider a situation where there was no usage of the product in the month completed:
|
|
January
|
February
|
March
|
April
|
May
|
June
|
July
|
|
Units Sold
|
100
|
133
|
145
|
90
|
154
|
0
|
?
|
A forecast based on the usage recorded in the previous six month equals 104 pieces:
(100 + 133 + 145 + 90 + 154 + 0) / 6 = 104
Neither 284 nor 104 pieces appears to be a good forecast for July. To ensure the accuracy of demand forecasts, it is critical that buyers examine possible unusual usage. There are several factors that can cause an item to have unusual demand activity.
-
Activity that will not reoccur. This includes abnormally large sales as well as unusually low usage that was caused by stock outs, items not being stocked properly, or invalid inventory.
-
The start of a new sales trend. There is a dramatic increase or decrease in usage that is representative of probable future usage of the product.
-
The wrong formula is being used to forecast future demand of the item.
In TransActPOS, an unusual usage will be marked with a UIR (User Interaction Required) checkbox. The calculated forecast will not be applied automatically.
If the possible unusual usage was caused by an activity that will not reoccur, override the forecast until adequate history that reflects the new trend has been accumulated.
Different Patterns of Usage Require Different Forecast Formulas
It would be easy if demand for every product could be forecasted by simply averaging the units sold over the previous six months. Because items do not always sell in a predetermined pattern, different forecasting formulas must be used. The average of past sales is just one element of a good forecasting model. A comprehensive forecasting model will also include other elements:
-
A weighted average of past usage
-
-
Identification of the proper time frame for the forecast, also known as the forecast horizon.
#7 in TransActPOS Forecasting
Last Year 2 Month Weighted Average Factor 2 and 1
Previous years sales history:
|
|
June
|
July
|
August
|
September
|
October
|
November
|
December
|
|
Units Sold
|
120
|
140
|
80
|
130
|
125
|
90
|
95
|
To aid in forecasting seasonal goods, the weighted average of last year two month forecast is a great tool. We are forecasting for July of this year, so we use July and August of the previous year.
|
Month
|
Units Sold
|
Weight
|
Extension
|
|
July
|
140
|
2
|
280
|
|
August
|
80
|
1
|
80
|
|
Total
|
|
3
|
360
|
The total extension of 360 is divided by the total weight of 3 to equal a weighted average of 130 units for July.
#8 in TransActPOS Forecasting
Last Year 2 Month Weighted Average Factor 4 and 1
Previous years sales history:
|
|
June
|
July
|
August
|
September
|
October
|
November
|
December
|
|
Units Sold
|
120
|
140
|
80
|
130
|
125
|
90
|
95
|
To aid in forecasting seasonal goods, the weighted average of last year two month forecast is a great tool. We are forecasting for July of this year, so we use July and August of the previous year.
|
Month
|
Units Sold
|
Weight
|
Extension
|
|
July
|
140
|
4
|
560
|
|
August
|
80
|
1
|
80
|
|
Total
|
|
5
|
640
|
The total extension of 640 is divided by the total weight of 5 to equal a weighted average of 128 units for July.
#10 in TransActPOS Forecasting
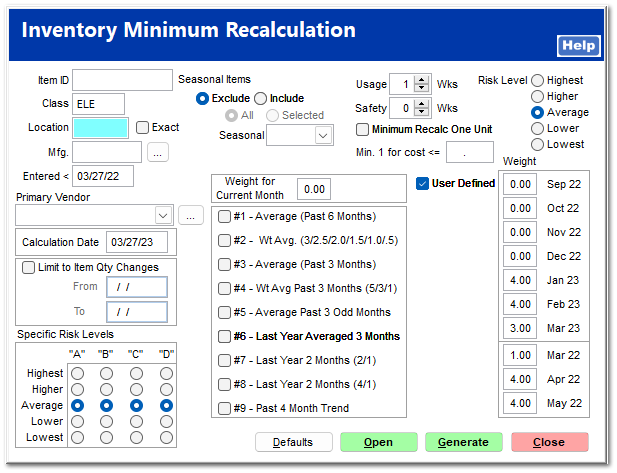
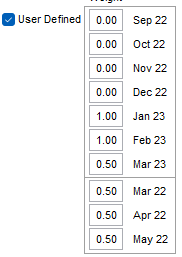
Weighted Average User Defined
If you don't like what we've come up with, no problem, we understand; it's your business. With a click of the mouse you can do it your way with the user defined weight tool. You can apply a factor of 9.99 to current month plus past five months and previous year ago plus the next two months.
|
Weight
|
|
|
0.00
|
Feb 06
|
|
0.00
|
Mar 06
|
|
0.00
|
Apr 06
|
|
0.00
|
May 06
|
|
0.00
|
Jun 06
|
|
0.00
|
Jul 06
|
|
0.00
|
Jul 05
|
|
0.00
|
Aug 05
|
|
0.00
|
Sep 05
|
#9 in TransActPOS Forecasting
Past 4 Month Trends
The average of past usage cannot result in a forecast that is greater (or less) than the largest (or smallest) monthly sales quantity included in the calculation. If monthly sales units are either consistently increasing or decreasing over time, a "trend factor" should be applied to the results of the weighted average formula. Going back to our example, let's look at how usage has increased, month to month, over the past several months:
|
|
March
|
|
April
|
|
May
|
|
June
|
|
Demand
|
100
|
|
133
|
|
145
|
|
156
|
|
% Increase in Demand
|
|
33.0%
|
|
9.0%
|
|
7.6%
|
|
This SKU has experienced an average increase of 16.5% [(33.0 + 9.0 + 7.6) / 3] over the previous 4 months. By increasing the weighted average amount of 131 units in the above example by 16.5%, the resulting forecast will be 154 units. The would seen to be a good estimate, considering the monthly increase is getting smaller.
Trend percentage should not be applied to every forecast calculation. Not every item has a consistent increase or decrease in usage over time.
Identify Products Whose Future Demand Cannot be Forecast
Items that have "sporadic" or irregular usage are next to impossible to accurately forecast. These are also your stores C and D ranked items.
Ensure you make enough margin on these items to carry them in your inventory. Or investigate why they are not better moving SKU's.
|
|
January
|
February
|
March
|
April
|
May
|
June
|
|
Usage
|
1
|
0
|
0
|
0
|
0
|
1
|
There are sales of one unit in January and 1 unit in June. Depending on the forecasting method you use the calculation may suggest your store stocks zero.
In these instances, I look at previous years (TLAR). If we consistently sell 1 or 2 a year over several years and the item has a good margin, we will keep it. If the item has poor margin and poor sales, we close it out and use the money somewhere else.
Another example of sporadic usage.
|
|
January
|
February
|
March
|
April
|
May
|
June
|
|
Usage
|
50
|
0
|
0
|
50
|
50
|
0
|
It seems that this SKU is sold in units of 50 at a time. Any average of the previous monthly usage will result in a forecast of less than 50 units. Products with sporadic usage can usually be identified as those whose average units sold in one transaction is greater than the average monthly usage. Instead of attempting to forecast demand, these products should be maintained with a minimum stock level. The minimum on hand quantity is a multiple of the of the normal quantity sold in one transaction. You would want to maintain a minimum of 50 units or one normal sale in the above example.
When the stock drops below the minimum of fifty units, enough product needs to be ordered to bring the stocking level back up to 50 units. If an item has a long lead time or requires a high level of service, you might consider maintaining a minimum stocking level of 2 normal sells quantities, or 100 units in this example.
In TransActPOS, an unusual usage will be marked with a UIR (User Interaction Required) checkbox. The calculated forecast will not be applied automatically.